The 2016 Presidential Election
You may recall that Trump won the 2016 election. It was very close. Hillary won the popular vote and Trump won the Electoral College vote. As it turns out, it is the Electoral College vote that decides who won. Someone should have explained that to Hillary before the election, not after.
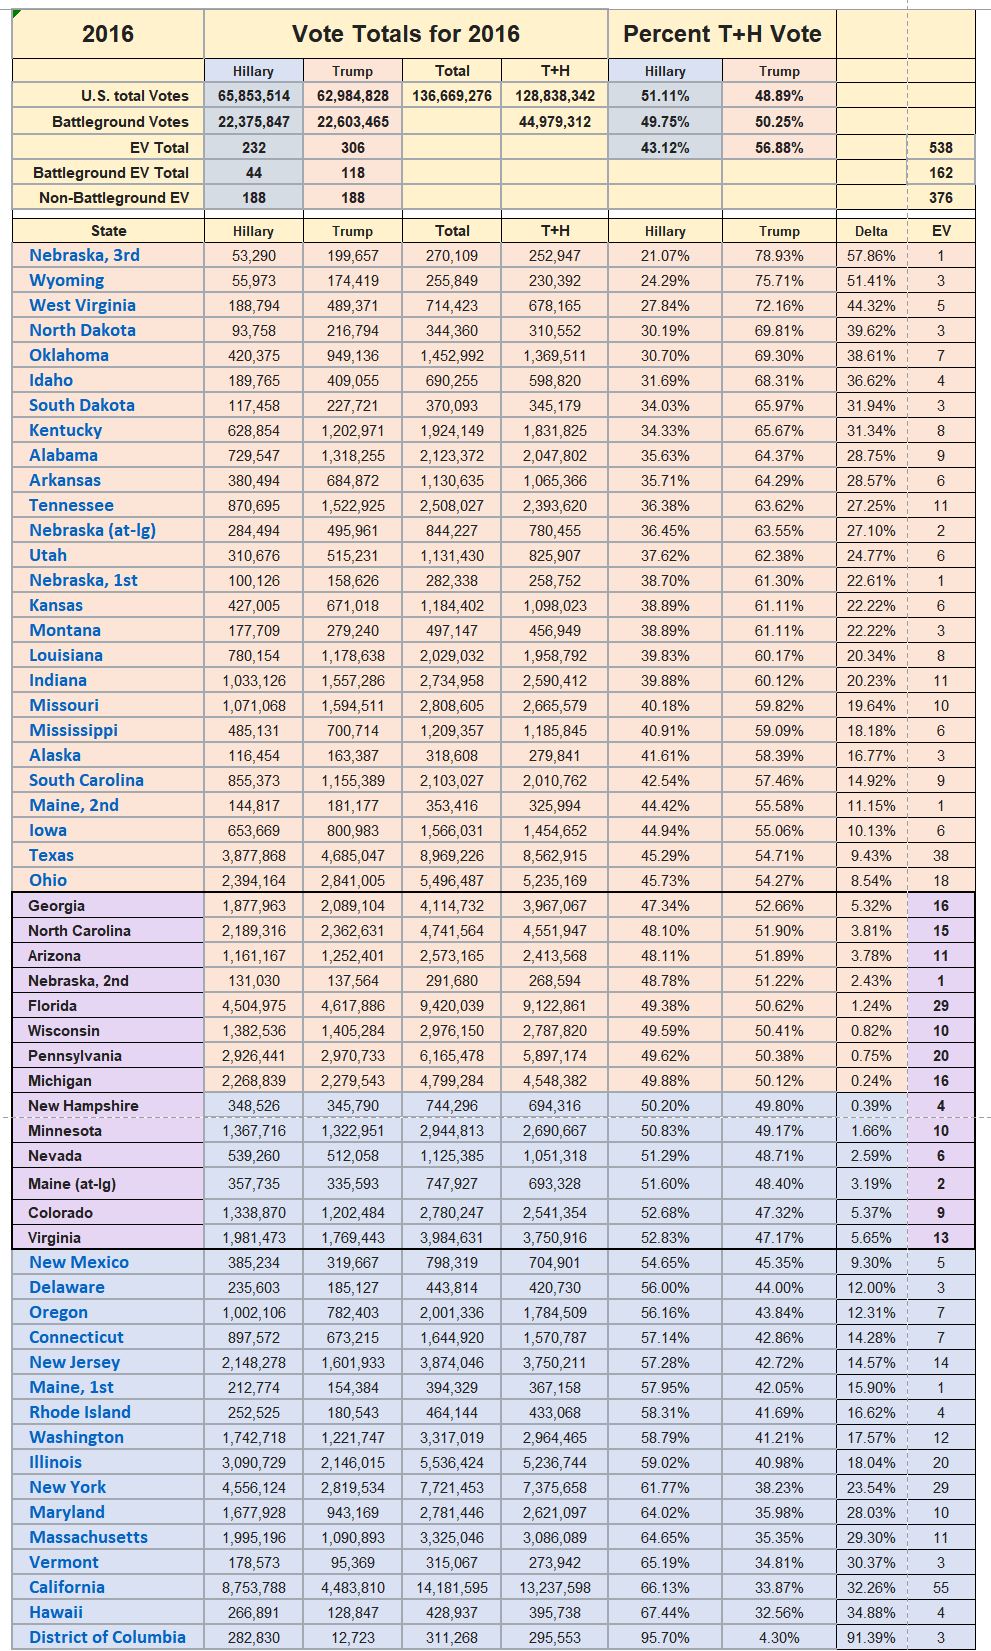
If you study the somewhat complicated chart below that was generated from the Wikipedia 2016 Presidential Election data there are a few things worth noting. (Just scroll down, you will see it.) For example, the total vote count was 136,669,276. But the votes for just Hillary and Trump totaled 128,838,342. The difference is the votes that went to 3rd party candidates. You can also see that Hillary got 48.18% of the popular vote and Trump got 46.09%. You can see that doesn’t add up to 100% of the total vote, once again because of those pesky 3rd Party candidates.
My preference when comparing the popular vote for Trump and Hillary and the associated vote margins is to base the figures on the total votes for just Trump and Hillary. Then the Trump and Hillary totals add to 100% of the votes. I call that normalization. There are probably other names for it.This makes very small differences in the percent margin between the candidates but makes, at least for me, the comparison of these margins between states easier to understand at a glance.
Another interesting thing you can see from the complicated chart: It has been sorted from best Trump states to best Hillary states. Trump won Nebraska’s Third District to win 1 of the 5 Nebraska Electoral Votes by 78.93% to 21.07%. It is not likely that the Democrats are going win this one in the near future.
OTOH, Hillary won the 3 Electoral votes for Washington D.C. by 95.70% to 4.30%. No, that is not a typo. Trump won just a little over 4% of the votes form the residents of Washington D.C. There are no prospects for a GOP victory in D.C.
As noted above, the chart is not sorted alphabetically by State. It is sorted by the Trump percentage in the final vote count. So any Trump vote above 50% is a state he won. Any Trump vote below 50% is a state Hillary won. The rows shown in orange are Trumps. The Hillary states are in blue.
But MOST IMPORTANT, the States and Electoral Votes highlighted in Purple are the Swing States. These 14 states range from those that Trump won by 5.32% to these he lost to Hillary by 5.65 %. The use of a bit more than a 5% between the candidates in the 2016 election as a baseline seems about right, at least as a starting point. And it does seem that Trump is unlikely to Lose Iowa, Texas or Ohio where he enjoyed very large margins. Likewise, New Mexico would seem to be safely in the Democrat camp.
For now.
As we all know, it takes 270 Electoral votes to win the Presidency, just one more than half of the 538 total for the election. In 2016 Trump had 306 electoral votes and Hillary had 232. That’s a margin of only 74 electoral votes. A loss of 38 of the votes for Trump and Hillary would be Queen. Sorry, I meant President.
The totals for just the 14 Swing States also has some interesting numbers. For example, the total of electoral votes is just 162 for the 14 these key states. In 2016 Trump won 118 electoral votes to 49 for Hillary in the 14 Swing States. And Trump won the popular vote in those 14 states as well by an extremely small margin. It was Trump 50.25% to Hillary 49.75%.
Also worth noting: In the non Swing States in 2016 it was a dead tie: 188 to 188. The rest of the country could have stayed home. Their votes canceled out. The 2016 election was decided by the people who live in the Swing States. That’s not likely to change in 2020. And the states that get the Swing State tag are not likely to change either. But I wouldn’t bet my life on it. 2020 will be an interesting year.