The 2020 Swing States
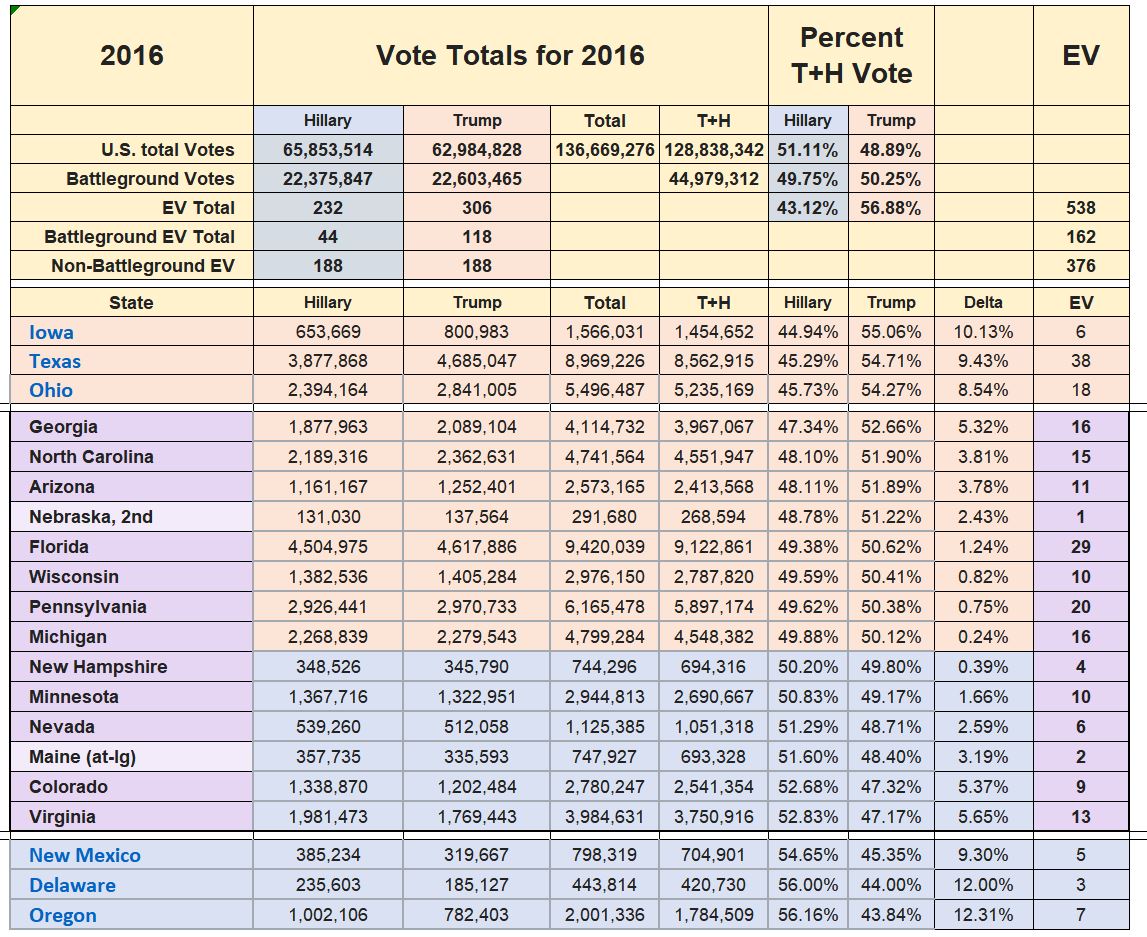
The 2016 Page listed the results of the 2016 election with the Swing States in the Trump – Hillary race highlighted in purple. The table below is an extract of the full election results that focuses on the Swing States. Note that the list of states is sorted on the Trump percentage with the Trump % + Hillary % normalized to 100 %.
There are 14 states shown in purple below. These are the 14 Swing States based on the 2016 election. The Nebraska and Maine entries, one won by Trump and the second by Hillary, are at the district level and carry only 1 electoral vote each. So for all practical purposes there are just 12 Swing States going into the 2020 election. The criteria for selecting just these 12 states are based on what seems like a natural break in the vote margins for each candidate. In Trumps that means a cutoff at Georgia where he had a margin of 5.32%. In Hillary’s case the break is at Virginia where she enjoyed a 5.65% advantage.
The really close races in 2016 were mostly won by Trump: By just 0.24% in MIchigan, 0.75% in Pennsylvania. 0.82% in Wisconsin and 1.24% in Florida. For Hillary the close races that she won were by 0.39% in New Hampshire and 1.66% in Minnesota.
Based on the 2016 data the states that are most likely to be added to this list are Ohio, Texas and Iowa on the Trump side. For Hillary it would be New Mexico, Delaware and Oregon. All of this states have margins that exceed 8.5%.